
Beneath the headlines, NSW has experienced a significant decline in property crime since 2000 with large reductions in burglary, motor vehicle theft, steal from motor vehicle, robberies and other property offences. Some of the greatest reductions are in the inner city.
GARNER CLANCEY and DR ROHAN LULHAM
Inner Sydney (and most of New South Wales) is in the grip of a property crime decline – not that many people would know it. It is, in fact, a very substantial decline. The headlines and news reports might lead you to think that we were witnessing rising crime, rather than a significant decline. Sadly, the old adage, ‘if it bleeds it leads’ still holds true. Commentary about crime tends to be dominated by the gruesome or the spectacular. There is little room for positive or mundane stories.
Acknowledging these falling rates will hopefully help to reduce the fear people have of being a victim of crime and ideally will help there to be a more considered debate about criminal justice policies. Understanding the causes of these falls will help to bring about further declines, as well as consider if and how violent offences can also be reduced.
Crime Categories and Statistics
Crime data is generally presented in NSW for 17 major offence categories. These offence categories include; murder, assaults (domestic violence and non-domestic violence related), robberies (without a weapon, with a weapon but not a firearm, and with a firearm), sexual and indecent assault, malicious damage to property (which includes graffiti and vandalism), fraud and a range of theft offences (including burglary, motor vehicle theft, theft from motor vehicle, and steal from retail store). Drug and other offences, while important, often do not get included in the list of 17 major offences because of the influence of policing practices on the number of recorded offences for these categories.
Published NSW crime statistics are based on incidents of crime reported to the NSW Police Force. This data is then analysed by the NSW Bureau of Crime Statistics and Research and made publicly available (crime data can be accessed from http://www.bocsar.nsw.gov.au/bocsar/bocsar_index.html).
It is well known that different offences have different reporting rates. Property offences such as burglary or motor vehicle theft have very high reporting rates because victims of these crimes often have insurance premiums that require a report to be made to the police. Offences like assault and sexual assault have low reporting rates, because the victim might know the offender and fear further attacks or violence.
Crime Statistics for Inner Sydney
Of these 17 major crime categories, the Inner Sydney Statistical Division (covering four local government areas – Sydney, Botany Bay, Marrickville and Leichhardt) has experienced declines in ten crime categories between 2000 and 2012. Four crime categories have gone up, one has been stable and trends could not be recorded for two other offence categories (i.e. murder and steal from person) due to the low numbers of murders and changes to the definition of steal from person. It is these declines that are of greatest interest here.
The Inner Sydney Statistical Division has witnessed the following percentage decline for the rate of key property offences between 2000 and 2012:
- 81.6% reduction in motor vehicle theft
- 82.2% reduction in steal from motor vehicle
- 77.6% reduction in break, enter and steal (i.e. burglary)
- 39.4% reduction in steal from dwelling (Source: NSW Bureau of Crime Statistics and Research)
These Inner Sydney falls are substantial and are greater than the NSW average for each offence, as shown by figures 1, 2 and 3.

Figure 1: Percentage change in the motor vehicle theft rate by Metropolitan SSD (2012 vs 2000)
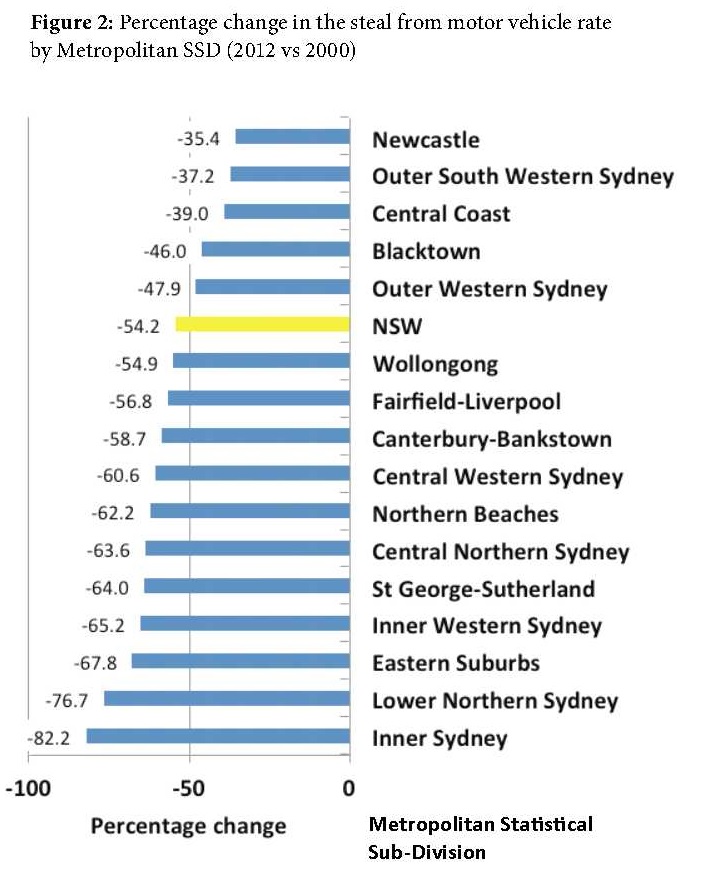
Percentage change in the steal from motor vehicle rate by Metropolitan SSD (2012 vs 2000)

Percentage change in the break and enter rate by Metropolitan SSD (2012 vs 2000)
As noted, while there are various problems with the accuracy of reported crime statistics, they generally do not apply to these offences. These types of property offence have very high reporting rates. This means that these substantial falls cannot be explained by changing reporting practices.
We also know that there have been significant falls in robbery offences (greater than 70% reductions across Sydney between 2000 and 2012).
Across Australia, NSW has led the way in the property decline. The falls in different property offences have tended to be greatest in NSW when compared to other States and Territories. Within NSW, the Sydney area has tended to have the greatest falls for many of these offences. This different picture across geographical areas means that there is still work to be done to ensure that all residents of NSW get to enjoy the same reductions in property crime.
Impact and Cause of the Decline
Substantially fewer people are now victims of these crimes in NSW than in the preceding decades. This has very real, positive human consequences. The trauma from having your home broken into, your car stolen, or having a gun or knife waved in your face during a robbery are reduced through there being far fewer victims. There are also numerous economic benefits, with less money needing to be spent on replacing stolen items, time lost through reporting crimes and dealing with insurance companies, and the inconvenience of not having a vehicle for an extended period. This should be a cause for some celebration.
So, if these falls are not due to changes in reporting of crime, then what has caused them? Is it a case that the money invested in rehabilitation and prevention across government and non-government agencies is finally paying off?
There has been limited research or analysis to shed light on what has caused these falls. The NSW Bureau of Crime Statistics and Research has examined different social trends and suggested that a reduction in heroin use and an improvement in employment and income levels might have contributed. Other factors might include focused policing practices, increased security and changes in the market for stolen goods. The falls in motor vehicle theft appear to be heavily influenced by the improvements in motor vehicle security. Improvements in home security have made it harder to commit burglary and the falling costs of many household items make them less attractive targets.
Further research in this area might help us to better understand the reasons for this remarkable decline in property crime. Understanding the causes of these falls in property crime might help us to further prevent or reduce these crimes.
International Crime Decline
To complicate efforts to explain the crime decline, there is evidence that other Western democratic nations have also experienced significant crime declines. In fact, the declines in countries like the United States of America (USA) and the United Kingdom (UK) started before our crime decline.
Frank Zimring, in his book, The Great American Crime Decline, revealed significant falls in major crime types in the United States. Using Federal Bureau of Investigation (FBI) uniform crime reports for seven ‘index offences’ in the USA between 1990 and 2000, Zimring revealed the following falls: 39% reduction in homicide; 41% reduction in rape; 44% reduction in robbery; 24% reduction in aggravated assault; 41% reduction in burglary; 37% reduction in auto theft; and 23% reduction in larceny. Starting in 1991, these substantial falls amounted to ‘the longest decline ever recorded’ in crime in the USA. While the magnitude of the decline has not continued into this century, FBI crime statistical reports show that crime rates in the USA have generally continued to fall or remain stable in recent years.
Graham Farrell and his colleagues have reviewed similar trends in the UK producing numerous publications looking at the different dimensions of the crime decline in England and Wales. Many of the trends in the USA have been replicated in the UK. Farrell and his colleagues demonstrated that violent crime fell by 49%, burglary 59%, and vehicle theft 65% between 1995 and 2007. Interestingly, it appeared that this decline in the UK started a few years after that of the USA, but a good five to six years prior to the decline in NSW.
Importance of the Property Crime Decline
The magnitude of the property crime decline should be of interest to everyone. This decline should (we suggest optimistically) impact on car and home insurance premiums, result in savings to the government through reduced criminal justice costs, and mean a little less political rhetoric is invested in bidding to be the toughest on crime. We should also seek to better understand the reasons for these falls, so that we can do more of what is working. We should also apply any relevant lessons to those crime types (where possible) that have not witnessed the same downward trends. Some violence offences and fraud, in particular, continue to increase or remain stable.
Bucking the Trend
While we have focused on the declines of ten offence categories in Inner Sydney between 2000 and 2012, four offences have gone up during this period: domestic violence-related assault, indecent assault, steal from retail store and fraud. The greatest increase has been in fraud offences, which have almost doubled during this period.
Many of these offences are likely to relate to credit card fraud and people driving off from petrol stations without paying. More prevention effort will need to be focused on this offence in particular over coming years, especially as new mechanisms make it easier to make (limited) use of stolen credit cards. The greater availability of push bikes also makes bikes vulnerable to increasing incidents of theft in years to come.
Alcohol-Related Assaults in Inner Sydney
Despite the good news reported here regarding property crime, there has been sustained attention given to alcohol-related assaults in Sydney in recent months. Saturation news coverage has followed incidents of what is fast becoming known as the ‘coward’s punch’. Tragic stories of unprovoked attacks have dominated news stories. Headlines like the following have commonly accompanied newspaper reports and television stories: ‘Alcohol-related violence crackdown’, ‘Sydney CBD’s angry mile of mindless violence continues to claim victims’ and ‘Nights of storms on street’. These headlines and the sustained concern regarding alcohol-related assaults in Inner Sydney have resulted in a raft of recent policy responses, including restrictions on trading hours, a freeze on new licenses and increased penalties for alcohol-related coward’s punch related deaths.
Getting accurate crime data on alcohol-related assaults is difficult. What level of consumption of alcohol is considered to be relevant to an act of assault is obviously open to debate. Similarly, it is well known that fewer assaults are reported to police than property offences. For these reasons it is very difficult to accurately estimate the level of alcohol-related assaults.
What we do know, despite the generally low reporting rates for assault, is that non-domestic assaults (alcohol-related) rose significantly between 2000 and 2007 and have been falling in the Inner Sydney Statistical Division since 2008 (see graph). This decline is promising, but needs to continue to return to earlier levels.

Non-domestic assault (alcohol related) in Sydney SSD
While the headlines continue to draw our attention to non-domestic violence alcohol-related assaults, there is still much to be done to prevent domestic violence. Domestic violence-related assaults have increased in Inner Sydney between 2000 and 2012 – it is one of only four offences (in
the list of 17 major offence categories) that have gone up in Inner Sydney in this period. Given that these offences frequently happen behind closed doors, they rarely attract the headlines. Imagine how often we would be reading about these offences if they attracted the same headlines or media attention as the assaults that have occurred in public places or licensed venues.
Our attention and resources should not just be invested in seeking ways to prevent non-domestic violence alcohol-related assaults. Many victims of domestic violence suffer repeated coward’s punches over extended periods.
Garner Clancey is a Lecturer in Criminology at Sydney Law School, Sydney University and Dr Rohan Lulhamis a Research Fellow at the Designing Out Crime Research Centre, University of Technology Sydney.
The source for all graphs is the NSW Bureau of Crime Statistics and Research. Dr Don Weatherburn kindly provided copies of these graphs.
References
Farrell, G.; Tilley, N.; Tseloni, A. and Mailey, J. (2008) ‘The Crime Drop and the Security Hypothesis’, British Society of Criminology Newsletter, No. 62, Winter 2008.
Weatherburn, D. and Holmes, J. (2013a) ‘The decline in robbery and theft: Inter-state comparisons’, Crime and Justice Statistics: Bureau Brief, Issue paper no. 89, July 2013, BOCSAR, Sydney.
Weatherburn, D. and Holmes, J. (2013b) ‘The Great Property Crime Drop: A regional analysis’, Crime and Justice Statistics, Bureau Brief, Issue paper no. 88, NSW Bureau of Crime Statistics and Research, Sydney.
Zimring, F. E. (2007) The Great American Crime Decline, Oxford University Press, Oxford.
References related to Headlines:
Fulde, G (2013) “Nights of storms on street”, The Daily Telegraph, 3 June, viewed January 2014 at http://www.dailytelegraph.com.au/news/opinion/nights-of-storms-on-street/story-fni0cwl5-1226655434571
Morri, M (2013) “Sydney CBD’s angry mile of mindless violence continues to claim victims” The Daily Telegraph, 3 June, viewed January 2014 at http://www.dailytelegraph.com.au/news/nsw/sydney-cbds-angry-mile-of-mindless-violence-continues-to-claim-victims/story-fni0cx12-1226655434818
Yahoo!7 (2013) “Alcohol-related violence crackdown” , Yahoo7 Pty Limited, 15 Dec 2013 viewed January 2014 at http://au.news.yahoo.com/nsw/video/watch/20340512/alcohol-related-violence-crackdown/