Regardless of how it is financed, all infrastructure is paid for by NSW residents , through either fees or taxes. So we deserve to know whether the government is prioritising projects that give us the greatest bang for our buck, writes Mathew Hounsell.
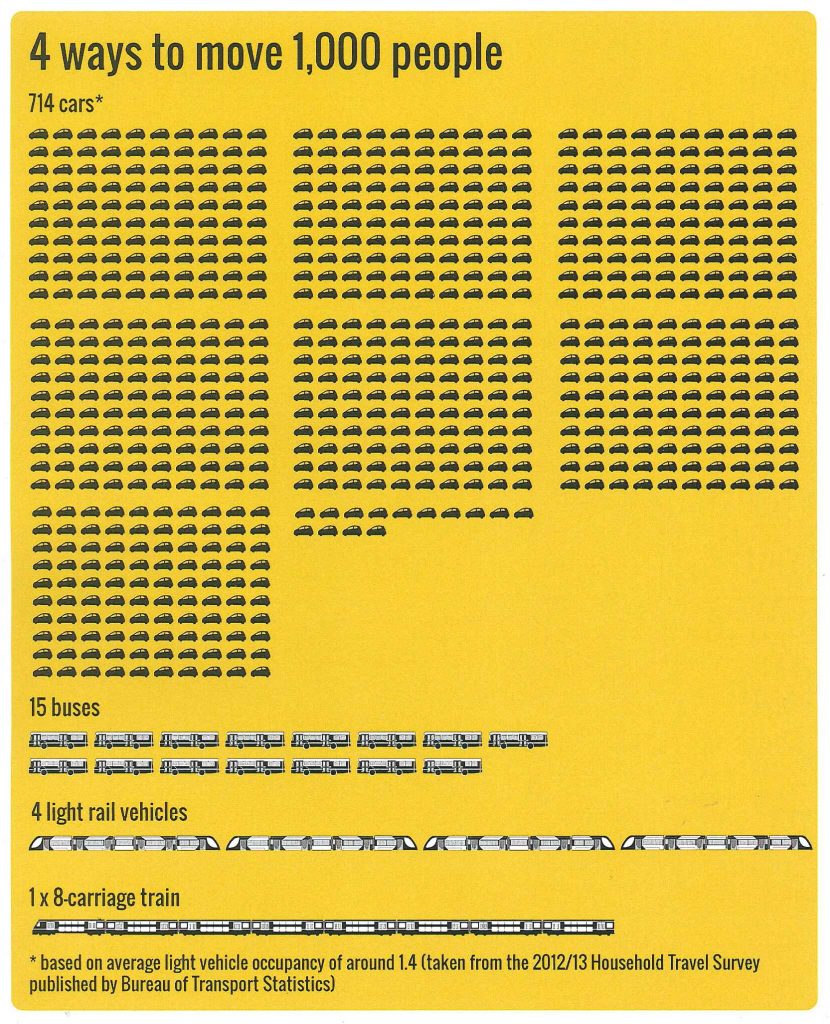
To move 24,000 people in an hour takes twenty double-deck trains, 100 light rail vehicles, 240 bendy-buses or a ten lane toll road.
The NSW and Commonwealth governments plan to spend $1.26 billion to build a 14 kilometre motorway from the M7 to the proposed airport at Badgerys Creek [1]. A six lane motorway could carry up to 7,200 persons an hour to the new employment centre of Western Sydney at a cost of $90 million per kilometre. Transurban, the remaining Sydney toll road operator, plans to build NorthConnex, a twin three lane, nine kilometre, motorway tunnel for $3 billion – $333 million a kilometre. The proposed WestConnex motorway is estimated to cost at least $15 billion [2].
That 7,200 hourly capacity looks feeble when compared to rail. For example, the Moreton Bay Rail Link (Commonweath and Queensland governments) is costing $1.15 billion [3]. It’s a 12.6 kilometre railway with six stations and twenty-two bridges, most over roads. With modern signalling one such two-track rail line can carry between 36,000 persons an hour, or 48,000 if you’re as ambitious and competent as the French.
Similarly, using forty-five metre long trams, one light rail line can carry 11,000 to 15,000 persons an hour. The new Gold Coast Light Rail, thirteen kilometres long with sixteen stops, and five bridges was estimated to cost $950 million (the exact price is apparently commercial-in-confidence). And this was quite expensive by Australian standards. In 2014 the Victorian treasury estimated that extending an existing light rail line, with electricity, stops, and intersection repairs should cost just $15 – $20 million per kilometre [4].
But there’s always a big song and dance about costs whenever public transport infrastructure is proposed in NSW. The RMS can-can distracts the media from the fact that public transport is not just cheaper per kilometre than motorways, it’s also cheaper and far more efficientt per-person. That’s not surprising when you consider a railway can carry five times the number of persons as a motorway.
There are three other very important numbers to consider – the amounts lost on our second, third and fourth largest imports. In the financial year 2012-13, crude oil imports cost $20.2 billion, passenger vehicle imports $17.3 billion and refined petroleum $16.8 billion (our largest import is overseas holidays and travel). In the three financial years 2010-13, Australia sent $151 billion overseas to our purveyors of petroleum and motor vehicles [5].
It spite of all this Treasury favours motorways over tracked public transport because all the operational cost is shifted off their books to the general public. Consider this: purchasing 6,000 Toyota Yarises (a popular light car) to move just one hours’ worth of people on, say, the proposed Badgerys Creek M12 will cost $120 million. Those millions includes the treasury’s cut of stamp duties and consumption taxes. The RACV estimates that the average annual cost for a family to run a light car such, as a Yaris, is $7,000 [6]. And of course registration fees and fuel taxes go to Treasury.
To justify spending mega-billions on more motorways, huge cost-of-congestion figures are bandied about – for example $4.6 billion a year for NSW – but these are numbers based on some rather questionable assumptions. To over-simplify slightly, they are calculated by assuming every extra minute spent in traffic is lost income and that if the road network was expanded then travel times would decrease.
The alternative options is usually ignored by the roads industry. Consider the phenomena of greatly reduced peak period road travel times experienced every school holidays when five or ten per cent of vehicles are suddenly missing from Sydney’s roads. It’s well known – less unnecessary car travel reduces road travel times.
Modern multi-modal transport planners have determined this is because of perceived cost, network speed, and induced demand. Put simply, poor (or unavailable) public transport and abundant road space ensure families make what Treasury considers the ‘right’ choice and spend that $7,000 a year on running another private car.
 The effects of these factors are obvious in the data. In the last decade two events saw Sydney’s road traffic increase and railway patronage drop substantially. The first occurred when the entire rail network was slowed in 2005, to stop headlines about late trains. The second was when the tolls were taken off the M4 motorway which runs parallel to Sydney’s busy western lines.
In spite of the temporary effects of these government decisions, across Sydney, train trips have grown by 24 per cent in the past decade, more than population which grew by 13 per cent. Even buses are more popular with a 19 per cent increase in trips. In contrast the EPA observed ‘While the number of trips in Sydney has been growing, the proportion of trips using private vehicles peaked in 2004–05 and is now the lowest it has been in 11 years’. [7]
And removal of station access fees (equivalent to removal of tolls off a motorway) have spurred big increases in rail use. Green Square station patronage doubled in the twelve months after the gate fee was removed in 2010, going from 1,470 passengers a day to 3,050 [8]. We can be sure that removal of the astronomical gate fees at International and Domestic Terminal stations would result in an increase in patronage and a corresponding decline in road use.
Appropriately-placed stations and frequent services draw people to public transport. Since it opened in 2009, Macquarie University station serves 8,700 passengers a day. At Rhodes, new units and offices – with reduced car parking – have seen Rhodes station go from 1,180 passengers in 2004 to 7,100 in 2013.
Under the current plans Sydney’s rail network will become so overcrowded that by 2020 passengers will be unable to board trains on the East Hills line. Shortly afterwards, the limits of the Western and Northern lines will be reached. The coming crunch is because the government has ignored the less-visible bottleneck recommendations of the 2001 Railway Clearways program. There are two major points in the cities rail network where three lines on six tracks run smoothly until they are forced to cram into four tracks. Then Coordinator General of Rail – Ron Christie – recommended that these bottlenecks be removed by adding two more tracks between Sydenham – Erskineville and Lidcombe – Homebush. He estimated that each section would cost just $100-200 million to increase capacity by fifty per-cent [9].
The $15 billion Westconnex proposal is over forty kilometres of new and widened roads and will be the world’s largest underground motorway. Unfortunately politicians and bureaucrats love mega-projects and have ignored the more cost-effective smaller projects. Smaller projects make sense individually but when combine produce an even greater benefits to the travelling public. Politicians have continued “captains-calls” to expand the road network despite it being inefficient for urban transport increasing the cost of living and increasing our already huge trade deficits.
A great city is built around a trunk of high capacity mass-transport, with an efficient road-network for those who need it like our essential services, and tradies, etc. This pattern defines all great cities not because of aesthetics but because of the laws of mathematics, physics and economics, none of which can be overcome by spin.
Mathew Hounsell is the Co-convenor of EcoTransit Sydney – http://ecotransit-votes.info/?page_id=5
Sources:
[1] Dept. of Infrastructure and Regional Development, Australian Government, 2015, “Western Sydney Infrastructure Plan”, Canberra, ACT, https://www.infrastructure.gov.au/infrastructure/western_sydney/
[2] NSW Government, 2014, “Westconnex; 2014-15 Assessment Brief”, Infrastructure Australia, Canberra, ACT.
[3] Dept. of Transport and Main Roads, 2014, “Moreton Bay Rail”, Brisbane, Queensland, http://www.tmr.qld.gov.au/moretonbayrail
[4] Dept. of Treasury and Finance, 2014, “Release of Costing of Election Commitment; Greens 003 – Fill missing tram links”, Melbourne, Victoria
[5] Trade Analysis and Statistics Section, Dept. of Foreign Affairs and Trade, 2013, “Composition of Trade Australia, 2012-13”, Canberra, ACT, ISBN 978-1-74322-127-3 (Book), ISBN 978-1-74322-128-0 (PDF format)
[6] Royal Automobile Club of Victoria (RACV), 2014, “Vehicle Operating Costs; Micro Cars”, Victoria, http://www.racv.com.au/wps/wcm/connect/racv/Internet/Primary/my+car/Operating+Costs
[7] NSW Environmental Protection Agency, 2012, “NSW State of the Environment Report 2012”, Sydney, NSW, Chapter 1 – People & Environment
[8] Bureau of Transport Statistics, 2015, “Train Ticket Sales and Journeys Data – July 2000 to December 2014”, Sydney, NSW, http://www.bts.nsw.gov.au/Statistics/Train/default.aspx
[9] Coordinator General for Rail, Ron Christie, 2001, “Long Term Strategic Plan for Rail – Greater Sydney Metropolitan Region – Overview Report”, Sydney, NSW

